Note
Go to the end to download the full example code.
G2++ short rate and 10-year yield#
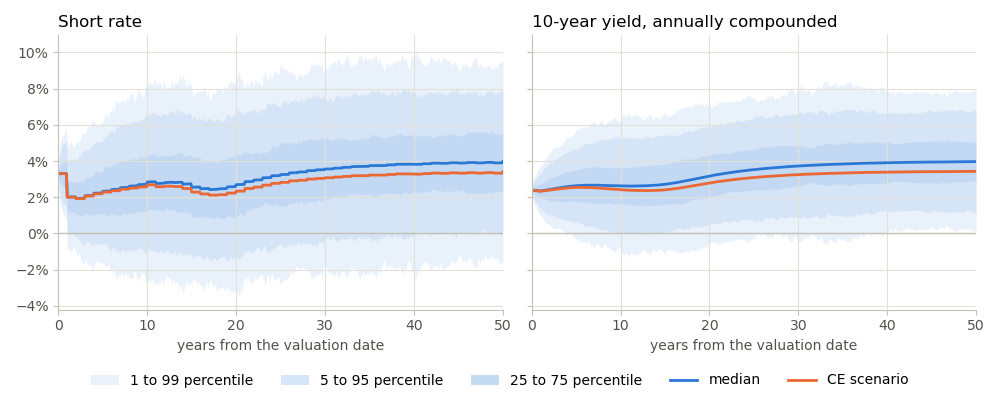
Fan charts of the short rate and of the 10-year yield in the scenarios that
BasicG2PP generates from g2pp_input.xlsx.
The blue bands are percentiles over the stochastic scenarios, around their median.
The orange line is the certainty-equivalent (CE) scenario, scenario 0,
which follows the initial forward curve.
See also
G2++ scenarios from BasicG2PP notebook in the
economiclibrary
import matplotlib.pyplot as plt
import modelx as mx
import numpy as np
from matplotlib.lines import Line2D
from matplotlib.patches import Patch
from matplotlib.ticker import PercentFormatter

# Chart style of the G2++ notebooks: blue for the stochastic scenarios, orange for CE
BLUE, ORANGE, INK_2, GRID, AXIS = "#2a78d6", "#eb6834", "#52514e", "#e1e0d9", "#c3c2b7"
plt.rcParams.update({
    "axes.edgecolor": AXIS, "axes.grid": True, "grid.color": GRID,
    "axes.spines.top": False, "axes.spines.right": False, "axes.titlelocation": "left",
    "axes.labelcolor": INK_2, "xtick.color": AXIS, "ytick.color": AXIS,
    "xtick.labelcolor": INK_2, "ytick.labelcolor": INK_2, "legend.frameon": False,
})
BANDS = [(1, 99), (5, 95), (25, 75)]    # nested percentile bands
WASH = 0.10                             # opacity of each band

g2pp = mx.read_model("BasicG2PP").G2PP
years = np.arange(g2pp.step_size() + 1) / 12

fig, axes = plt.subplots(1, 2, figsize=(10, 4), sharey=True)
for ax, paths, title in [(axes[0], g2pp.short_rate_paths(), "Short rate"),
                         (axes[1], g2pp.spot_rate_paths(120),
                          "10-year yield, annually compounded")]:
    stochastic = paths[1:]
    for lo, hi in BANDS:
        ax.fill_between(years, np.percentile(stochastic, lo, axis=0),
                        np.percentile(stochastic, hi, axis=0),
                        color=BLUE, alpha=WASH, linewidth=0)
    ax.plot(years, np.median(stochastic, axis=0), color=BLUE, linewidth=2)
    ax.plot(years, paths[0], color=ORANGE, linewidth=2)
    ax.axhline(0, color=AXIS, linewidth=1)
    ax.set_title(title)
    ax.set_xlabel("years from the valuation date")
    ax.set_xlim(0, years[-1])
    ax.yaxis.set_major_formatter(PercentFormatter(1.0, decimals=0))

handles = [Patch(color=BLUE, alpha=1 - (1 - WASH) ** k, linewidth=0,
                 label=f"{lo} to {hi} percentile")
           for k, (lo, hi) in enumerate(BANDS, start=1)]
handles += [Line2D([], [], color=BLUE, linewidth=2, label="median"),
            Line2D([], [], color=ORANGE, linewidth=2, label="CE scenario")]
fig.legend(handles=handles, loc="lower center", ncols=5)
fig.tight_layout(rect=(0, 0.08, 1, 1))
Total running time of the script: (0 minutes 1.089 seconds)