Note
Go to the end to download the full example code.
G2++ martingale tests#
Two checks that the scenarios of BasicG2PP reproduce the market
prices they start from.
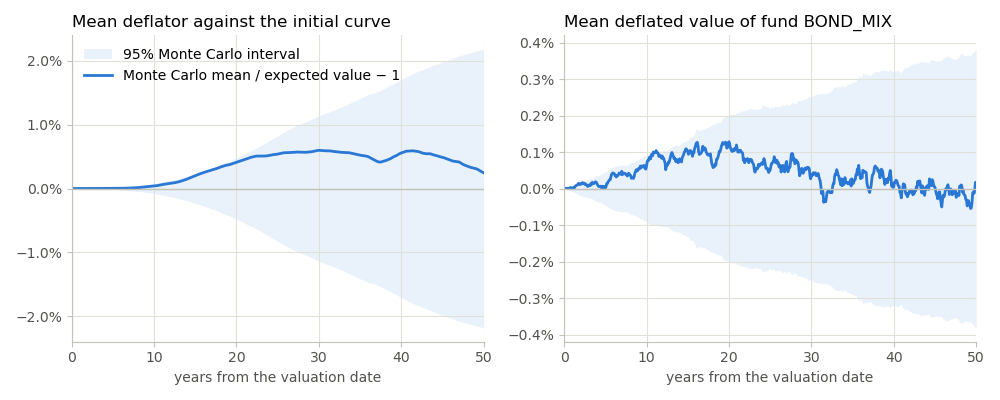
On the left, the mean deflator over the stochastic scenarios matches the initial
discount factor at every month, \(E[D(t)] = P^M(0, t)\).
On the right, the mean deflated value of the bond fund stays at its initial value,
\(E[D(t)AV(t)] = AV(0)\), because the fund trades only bonds and cash.
The bands are 95% Monte Carlo intervals, from the standard errors of antithetic
pair means.
See also
G2++ scenarios from BasicG2PP notebook in the
economiclibrary
import matplotlib.pyplot as plt
import modelx as mx
import numpy as np
from matplotlib.ticker import PercentFormatter

# Chart style of the G2++ notebooks
BLUE, INK_2, GRID, AXIS = "#2a78d6", "#52514e", "#e1e0d9", "#c3c2b7"
plt.rcParams.update({
    "axes.edgecolor": AXIS, "axes.grid": True, "grid.color": GRID,
    "axes.spines.top": False, "axes.spines.right": False, "axes.titlelocation": "left",
    "axes.labelcolor": INK_2, "xtick.color": AXIS, "ytick.color": AXIS,
    "xtick.labelcolor": INK_2, "ytick.labelcolor": INK_2, "legend.frameon": False,
})

model = mx.read_model("BasicG2PP")
g2pp, validation = model.G2PP, model.Validation
years = np.arange(g2pp.step_size() + 1) / 12

fig, axes = plt.subplots(1, 2, figsize=(10, 4))
for ax, test, title in [
        (axes[0], validation.martingale_test(), "Mean deflator against the initial curve"),
        (axes[1], validation.fund_martingale_test(),
         f"Mean deflated value of fund {g2pp.fund_id()}")]:
    half_width = 1.96 * test["se"] / test["theory"]
    ax.fill_between(years, -half_width, half_width, color=BLUE, alpha=0.1, linewidth=0,
                    label="95% Monte Carlo interval")
    ax.plot(years, test["mc"] / test["theory"] - 1, color=BLUE, linewidth=2,
            label="Monte Carlo mean / expected value \N{MINUS SIGN} 1")
    ax.axhline(0, color=AXIS, linewidth=1)
    ax.set_title(title)
    ax.set_xlabel("years from the valuation date")
    ax.set_xlim(0, years[-1])
    ax.yaxis.set_major_formatter(PercentFormatter(1.0, decimals=1))
axes[0].legend(loc="upper left")
fig.tight_layout()
Total running time of the script: (0 minutes 0.636 seconds)