Note
Go to the end to download the full example code.
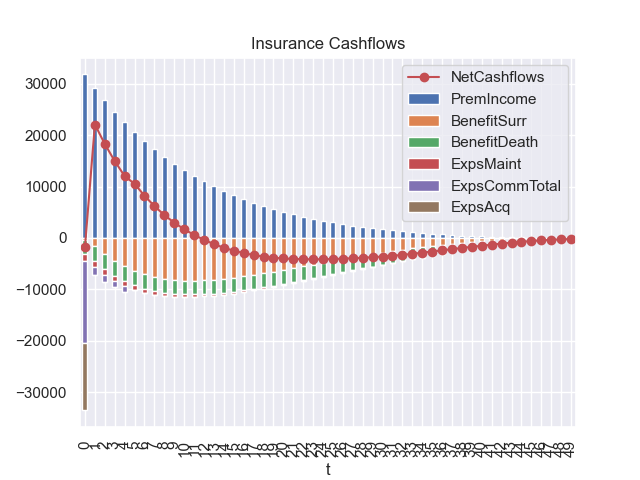
simplelife: cashflow#
Draw a graph of liability cashflows of a simple whole life policy
Run this sample now!
![]()
See also
The
simplelifelibrary
import pandas as pd
import modelx as mx
import seaborn as sns
sns.set_theme(style="darkgrid")

polid = 171
proj = mx.read_model("model").Projection[polid]

# Draw NetCashflows Graph
data = {'NetCashflows': [proj.NetInsurCF[t] for t in range(50)]}
ax = pd.DataFrame(data).plot.line(marker='o', color='r')

# Draw componets of net cashflows

vars = ['PremIncome',
        'BenefitSurr',
        'BenefitDeath',
        'ExpsMaint',
        'ExpsCommTotal',
        'ExpsAcq']

df = proj.cells[vars].to_frame(range(50))

df[vars[1:]] = df[vars[1:]].mul(-1)   # Change outflows to negatives
df.plot(kind='bar', stacked=True, ax=ax, title='Insurance Cashflows')
Total running time of the script: (0 minutes 1.132 seconds)