Note
Go to the end to download the full example code.
Dynamic policy decrement#
As explained in 2. Extended Stochastic Example, most variable annuity models include dynamic lapse assumptions. A dynamic lapse assumption is used to reflect such policy holder’s behaviour that they are more likely to terminate their policies when their account values are larger in comparison to the guaranteed amounts of their policies than they are when the account values are smaller than the guaranteed amounts.
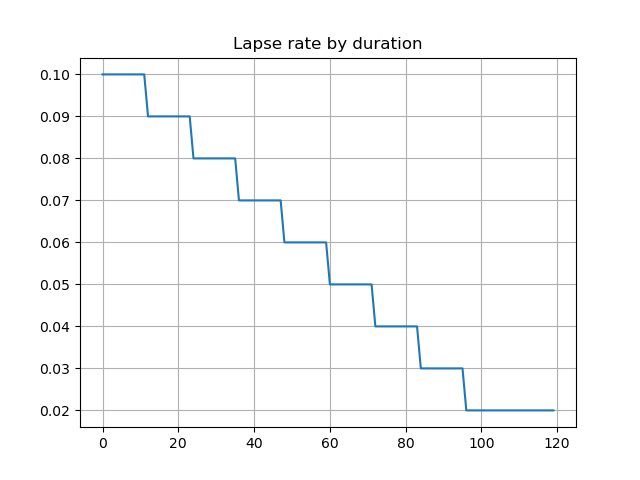
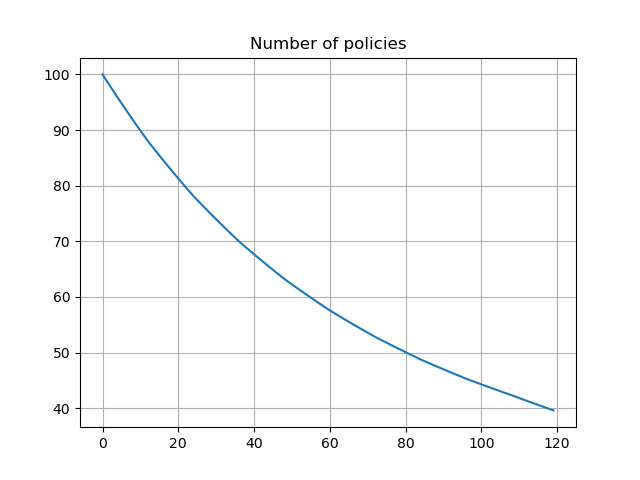
The graph shows deterministic lapse rates and policy decrement based on the lapse rates. The lates and derement do not vary by scenarios.
import numpy as np
import pandas as pd
import modelx as mx
import matplotlib.pyplot as plt


model = mx.read_model('CashValue_ME_EX2')
proj = model.Projection

pd.Series(proj[4].lapse_rate(t).loc[1][1] for t in range(120)).plot.line(
    legend=False, grid=True, title='Lapse rate by duration')

plt.subplots()
pd.Series(proj[4].pols_if_at(t, 'BEF_DECR').loc[1][1] for t in range(120)).plot.line(
    legend=False, grid=True, title='Number of policies')
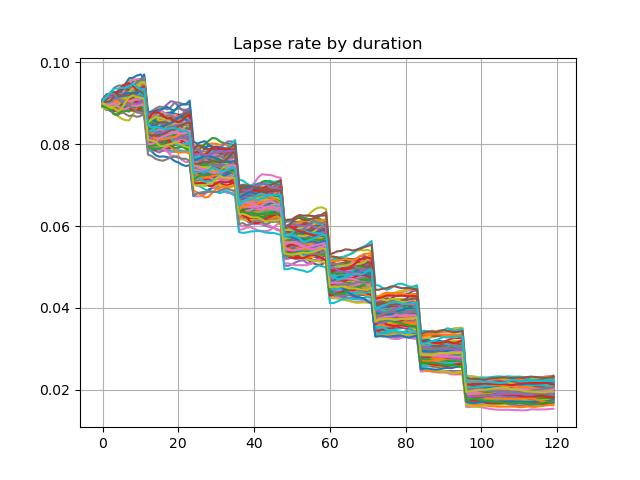
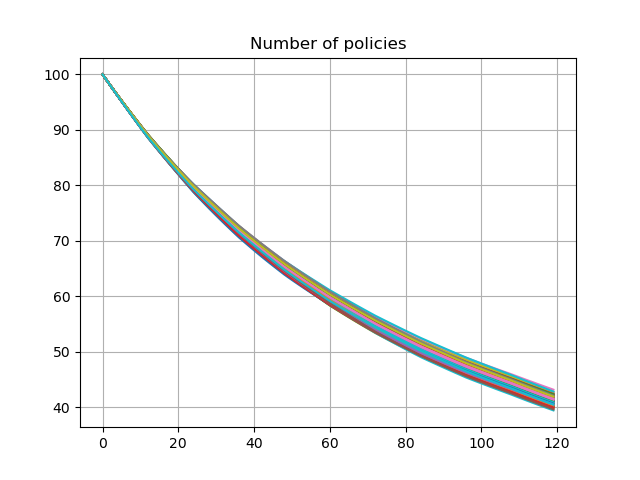
The graph below shows lapse rates and policy decrement for the first 100 scenarios, when a dynamic lapse is factored into the assumption. The lapse rates vary by in-the-moneyness of the account value and the number of remaining policies also vary by scenarios.
df = pd.DataFrame({t: proj[5].lapse_rate(t).loc[1][:100] for t in range(120)})
df.transpose().plot.line(legend=False, grid=True, title='Lapse rate by duration')

df = pd.DataFrame({t: proj[5].pols_if_at(t, 'BEF_DECR').loc[1][:100] for t in range(120)})
df.transpose().plot.line(legend=False, grid=True, title='Number of policies')

model.close()
See also
2. Extended Stochastic Example notebook in the
savingslibrary
Total running time of the script: (0 minutes 2.117 seconds)