Note
Go to the end to download the full example code.
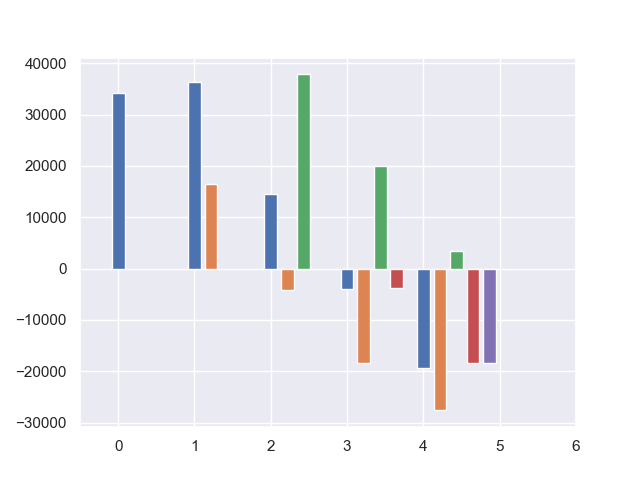
nestedlife: Present value of cashflows#
Draw a graph of present value of cashflow
See also
The
nestedlifelibrary
import numpy as np
import matplotlib.pyplot as plt
import seaborn as sns
sns.set_theme(style="darkgrid")
import modelx as mx

model = mx.read_model("model")

# Policy point ID and aliases
polid = 171
outer = model.OuterProj

# Code block for overwiting the defaut model

outer[polid].asmp.SurrRateMult[1] = 2
outer[polid].asmp.SurrRateMult[2] = 0.5
outer[polid].asmp.SurrRateMult[3] = 1

outer[polid].InnerProj[1].asmp.SurrRateMult[1] = 2
outer[polid].InnerProj[2].asmp.SurrRateMult[2] = 0.5
outer[polid].InnerProj[3].asmp.SurrRateMult[3] = 1

# Code block for PV graph

def draw_bars(item):

    term = 5

    expect = []
    for t0 in range(term):
        expect_t0 = [np.nan] * term
        for t in range(t0, term):
            cells = outer[polid].InnerProj[t0].cells[item]
            expect_t0[t] = cells[t]

        expect.append(expect_t0)

    fg, ax = plt.subplots()
    ax.set_xlim(left=-0.5, right=term + 1)

    for t0 in range(term):
        draw_single_bar(expect[t0], ax, t0)


def draw_single_bar(data, ax, t0):

    size = len(data)
    width = 1/ (size + 1)
    ax.bar(np.arange(size) + t0 * (width + 0.05), data, width)


draw_bars('PV_NetCashflow')
Total running time of the script: (0 minutes 0.502 seconds)