Note
Go to the end to download the full example code.
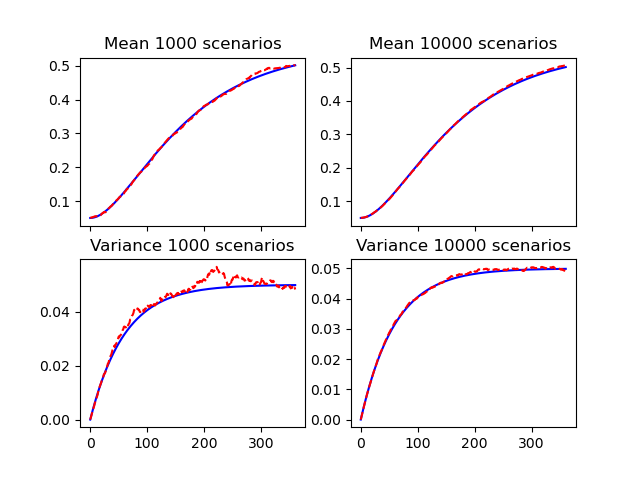
Short rate mean and variance#
The means and variances of the simulated short rates.
For each \(t_i\), the mean and the variance of the short rate \(r(t_i)\) should converge to \(E\{r(t_i) | \mathcal{F}_{0}\}\) and \(Var\{r(t_i) | \mathcal{F}_{0}\}\).
See also
Overview of BasicHullWhite notebook in the
economiclibrary
import modelx as mx
import matplotlib.pyplot as plt

HW = mx.read_model("BasicHullWhite").HullWhite

fig, axs = plt.subplots(2, 2, sharex=True, sharey=False)

for size, h in zip([1000, 10000], [0, 1]):
    HW.scen_size = size
    axs[0, h].plot(range(HW.step_size + 1), HW.E_rt(), "b-")
    axs[0, h].plot(range(HW.step_size + 1), HW.mean_short_rate(), "r--")
    axs[0, h].set_title('Mean ' + str(size) + ' scenarios')
    axs[1, h].plot(range(HW.step_size + 1), HW.Var_rt(), "b-")
    axs[1, h].plot(range(HW.step_size + 1), HW.var_short_rate(), "r--")
    axs[1, h].set_title('Variance ' + str(size) + ' scenarios')
Total running time of the script: (0 minutes 0.304 seconds)