Note
Go to the end to download the full example code.
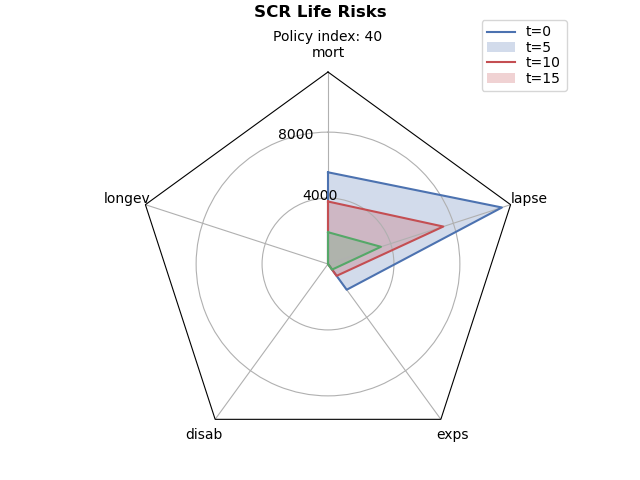
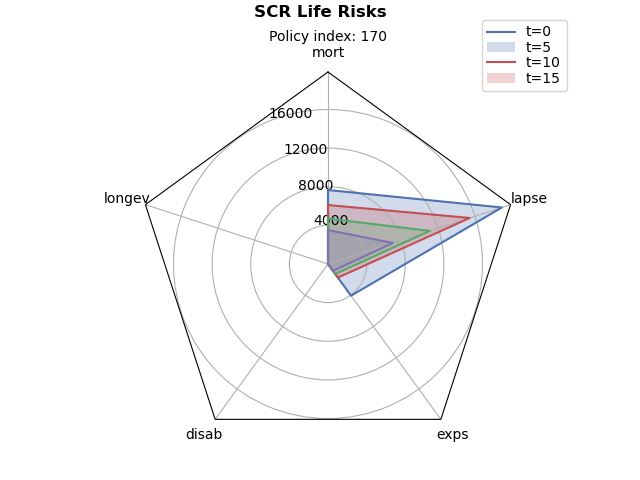
TradLife_A_EX1: Life SCR radar chart#
Radar charts of the Solvency II life sub-risk capital requirements for
selected policies, projected by the annuallife TradLife_A_EX1
model. Each spoke of the radar chart represents a life sub-risk
(risk_life_sub()), and each ring
shows the sizes of those sub-risks at a projection time t.
See also
The
annuallifelibrary
import modelx as mx
import pandas as pd
from draw_charts_radar import draw_radar

model = mx.read_model("TradLife_A_EX1")
LifeRiskID = model.Enums.LifeRiskID

# (label, LifeRiskID code) for each radar spoke
risks = [('mort', LifeRiskID.MORT),
         ('longev', LifeRiskID.LONGV),
         ('disab', LifeRiskID.DISAB),
         ('exps', LifeRiskID.EXPS),
         ('lapse', LifeRiskID.LAPSE)]


def draw(idx):

    proj = model.Projection[idx]

    data = {}
    for t in range(0, 20, 5):
        data['t=' + str(t)] = pd.Series(
            {label: proj.risk_life_sub(t, risk) for label, risk in risks})

    draw_radar(pd.DataFrame(data),
               ax_title='Policy index: ' + str(idx),
               fig_title='SCR Life Risks')


# idx 40 / 170 correspond to PolicyID 41 / 171 in simplelife (0-based).
for i in (40, 170):
    draw(i)
Total running time of the script: (0 minutes 2.654 seconds)