Note
Go to the end to download the full example code.
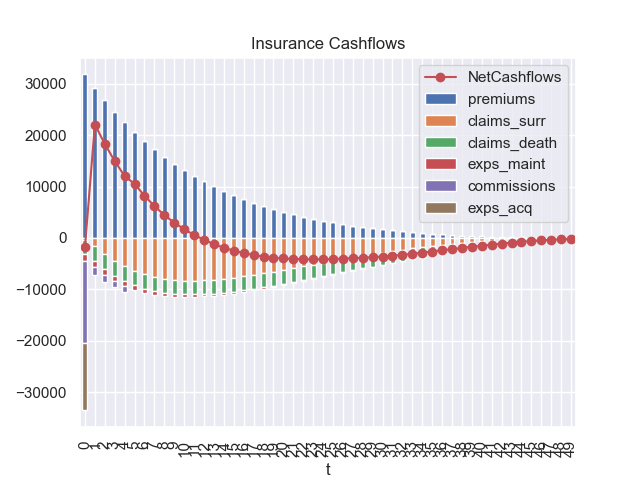
TradLife_A: cashflow#
Draw a graph of liability cashflows of a simple whole life policy
projected by the annuallife TradLife_A model.
See also
The
annuallifelibrary
import pandas as pd
import modelx as mx
import seaborn as sns
sns.set_theme(style="darkgrid")

# PolicyID 171 in simplelife corresponds to idx 170 (0-based array index)
# in TradLife_A.
idx = 170
proj = mx.read_model("TradLife_A").Projection[idx]

# Draw NetCashflows Graph
data = {'NetCashflows': [proj.net_cf[t] for t in range(50)]}
ax = pd.DataFrame(data).plot.line(marker='o', color='r')

# Draw components of net cashflows

vars = ['premiums',
        'claims_surr',
        'claims_death',
        'exps_maint',
        'commissions',
        'exps_acq']

for cells in vars:
    list(proj.cells[cells](t) for t in range(50))

df = proj.frame[vars].sort_index().dropna().droplevel(['x', 'y', 'basis'])
df.index = df.index.astype(int)

df[vars[1:]] = df[vars[1:]].mul(-1)   # Change outflows to negatives
df.plot(kind='bar', stacked=True, ax=ax, title='Insurance Cashflows')
Total running time of the script: (0 minutes 0.641 seconds)