Note
Go to the end to download the full example code.
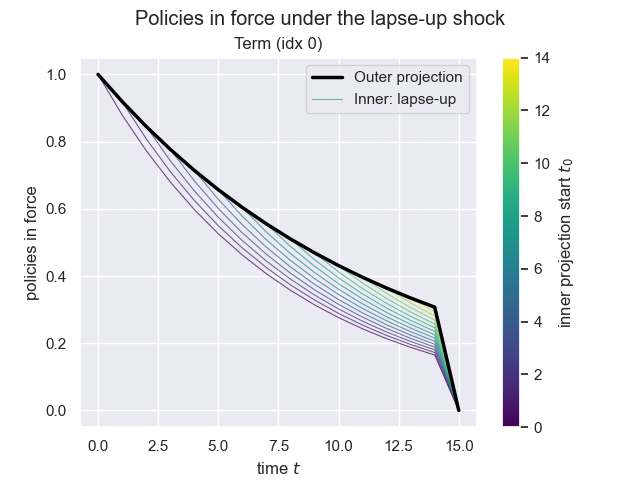
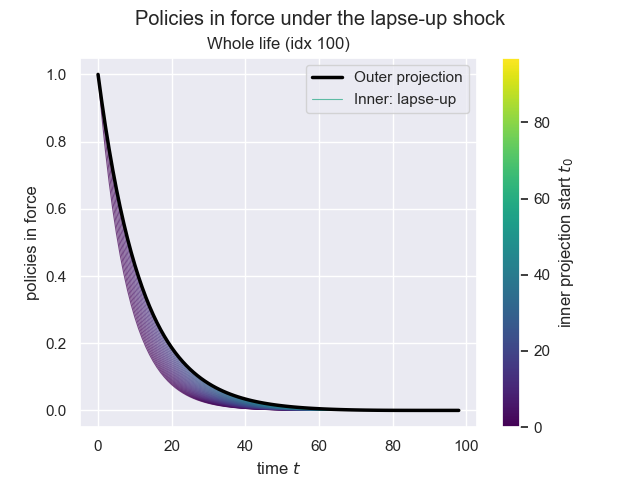
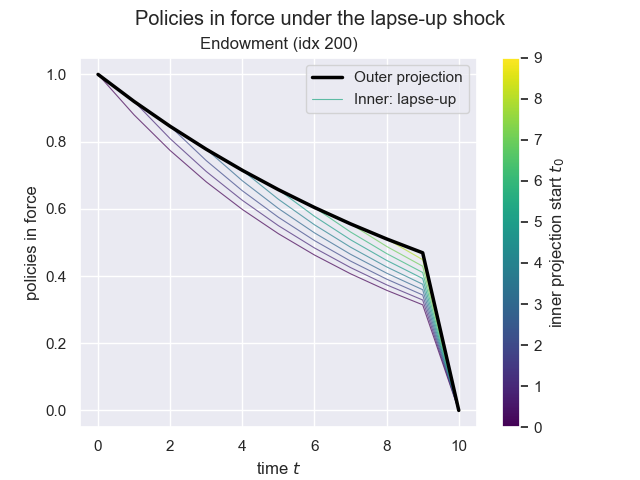
TradLife_A_EX1: in-force run-off under the lapse-up shock#
For one model point of each product (term, whole life and endowment),
this chart shows how the number of policies in force runs off, projected
by the annuallife TradLife_A_EX1 model.
The bold black line is the number of policies in force in the outer
projection (pols_if_beg1()). Each
thin coloured line is the in-force of an inner projection under the
Solvency II lapse-up shock (InnerProj[t0, LAPSE, UP]), anchored at a
valuation time t0 that ranges from 0 to the end of the projection.
Every inner line branches off the outer curve at its own t0 (the
colour key) and then declines faster, because the lapse-up shock raises
the surrender rate.
The in-force shown is the beginning-of-period count
pols_if_beg1(), which already
includes the new business written at t = 0 and so starts at the full
policy count (rather than
pols_if(), the end-of-period
count, which is zero at t = 0).
See also
The
annuallifelibrary
import modelx as mx
import matplotlib.pyplot as plt
import matplotlib.cm as cm
from matplotlib.lines import Line2D
import seaborn as sns
sns.set_theme(style="darkgrid")

model = mx.read_model("TradLife_A_EX1")
LifeRiskID = model.Enums.LifeRiskID
LapseShockID = model.Enums.LapseShockID

# One model point for each product (term, whole life, endowment).
points = [('Term', 0), ('Whole life', 100), ('Endowment', 200)]


def draw(name, idx):

    proj = model.Projection[idx]
    last_t = proj.proj_len()

    fig, ax = plt.subplots()
    fig.suptitle('Policies in force under the lapse-up shock')

    # Inner projections under the lapse-up shock, one per valuation time
    # t0 = 0 .. last_t - 1, coloured by t0.
    cmap = plt.get_cmap('viridis')
    for t0 in range(0, last_t):
        inner = proj.InnerProj[t0, LifeRiskID.LAPSE, LapseShockID.UP]
        ts = range(t0, last_t + 1)
        ax.plot(list(ts), [inner.pols_if_beg1(t) for t in ts],
                color=cmap(t0 / max(last_t - 1, 1)),
                linewidth=0.8, alpha=0.7)

    # Outer projection in force, drawn on top.
    ts = range(0, last_t + 1)
    (outer_line,) = ax.plot(list(ts), [proj.pols_if_beg1(t) for t in ts],
                            color='black', linewidth=2.5, zorder=3)

    sm = cm.ScalarMappable(cmap=cmap, norm=plt.Normalize(0, max(last_t - 1, 1)))
    sm.set_array([])   # required for colorbar on older matplotlib
    fig.colorbar(sm, ax=ax, label='inner projection start $t_0$')

    ax.set_title(name + ' (idx ' + str(idx) + ')')
    ax.set_xlabel('time $t$')
    ax.set_ylabel('policies in force')
    inner_proxy = Line2D([], [], color=cmap(0.6), linewidth=0.8, alpha=0.7)
    ax.legend([outer_line, inner_proxy],
              ['Outer projection', 'Inner: lapse-up'], loc='upper right')
    return ax


for name, idx in points:
    draw(name, idx)
Total running time of the script: (0 minutes 2.501 seconds)