Note
Click here to download the full example code
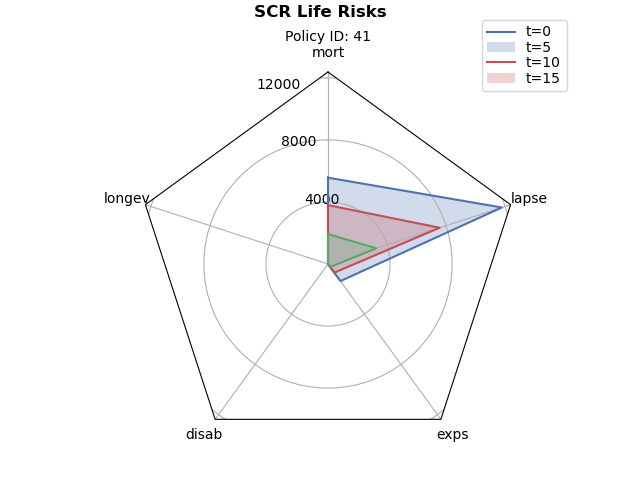
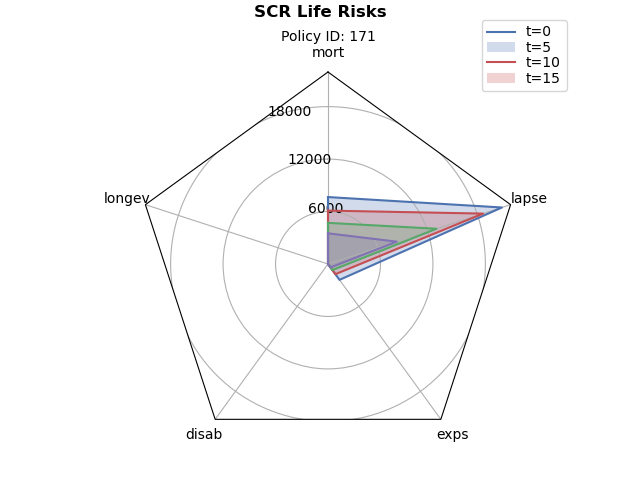
solvency2: Life SCR radar chart#
This script draws radar charts for selected policies. Each spoke of the radar chart represents a sub risk of SCR life risks, and the sizes of the sub risks by duration are drawn in the radar chart.
See also
The
solvency2library
import modelx as mx
import pandas as pd
from draw_charts_radar import draw_radar

model = mx.read_model("model")
scr = model.SCR_life
risks = ('mort', 'longev', 'disab', 'exps', 'lapse')
scenid = 1


def draw(polid):

    data = {}
    for t in range(0, 20, 5):
        data['t=' + str(t)] = scr[t, polid, scenid].Life.to_series(risks)

    draw_radar(pd.DataFrame(data),
               ax_title='Policy ID: ' + str(polid),
               fig_title='SCR Life Risks')

for i in (41, 171):
    draw(i)
Total running time of the script: ( 0 minutes 2.291 seconds)